

If you’ve ever wondered how visible your brand really is when customers are searching online, you’re not alone. Many marketers struggle to measure digital attention in a way that’s both timely and actionable.
In my experience, traditional metrics like market share or survey data often lag behind real consumer interest. That’s why I rely on share of search—it’s a straightforward metric that reveals how your brand stacks up against competitors in real time.
This article breaks down exactly what share of search means, how to calculate it, and which tools make the process easier. I’ll walk you through practical steps for defining your market, choosing the right competitors, and sidestepping common pitfalls like ambiguous brand names or incomplete data.
You’ll also see how share of search compares to other metrics, why it’s a powerful predictor of market shifts, and how leading brands use it to spot opportunities before sales numbers catch up. By the end, you’ll have clear, actionable strategies to measure and improve your brand’s digital presence.
What is share of search?
Definition and basic calculation of share of search
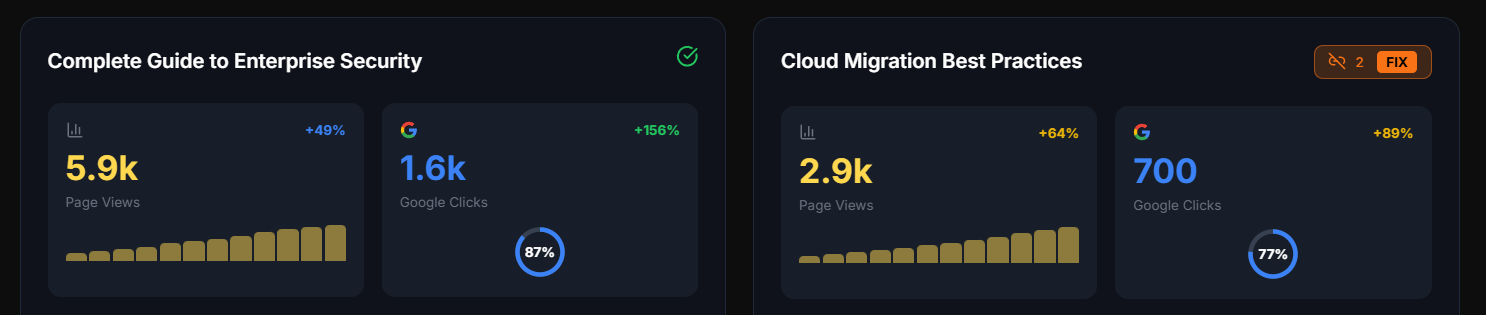
So, what exactly is share of search? In simple terms, it’s a metric that shows how visible your brand is when people are hunting online. Think of it as measuring the percentage of times consumers search for your brand, as opposed to every other rival in your market. The magic here is that it’s an ongoing snapshot of brand attention online — and it lets you see how you stack up against competitors at a glance.
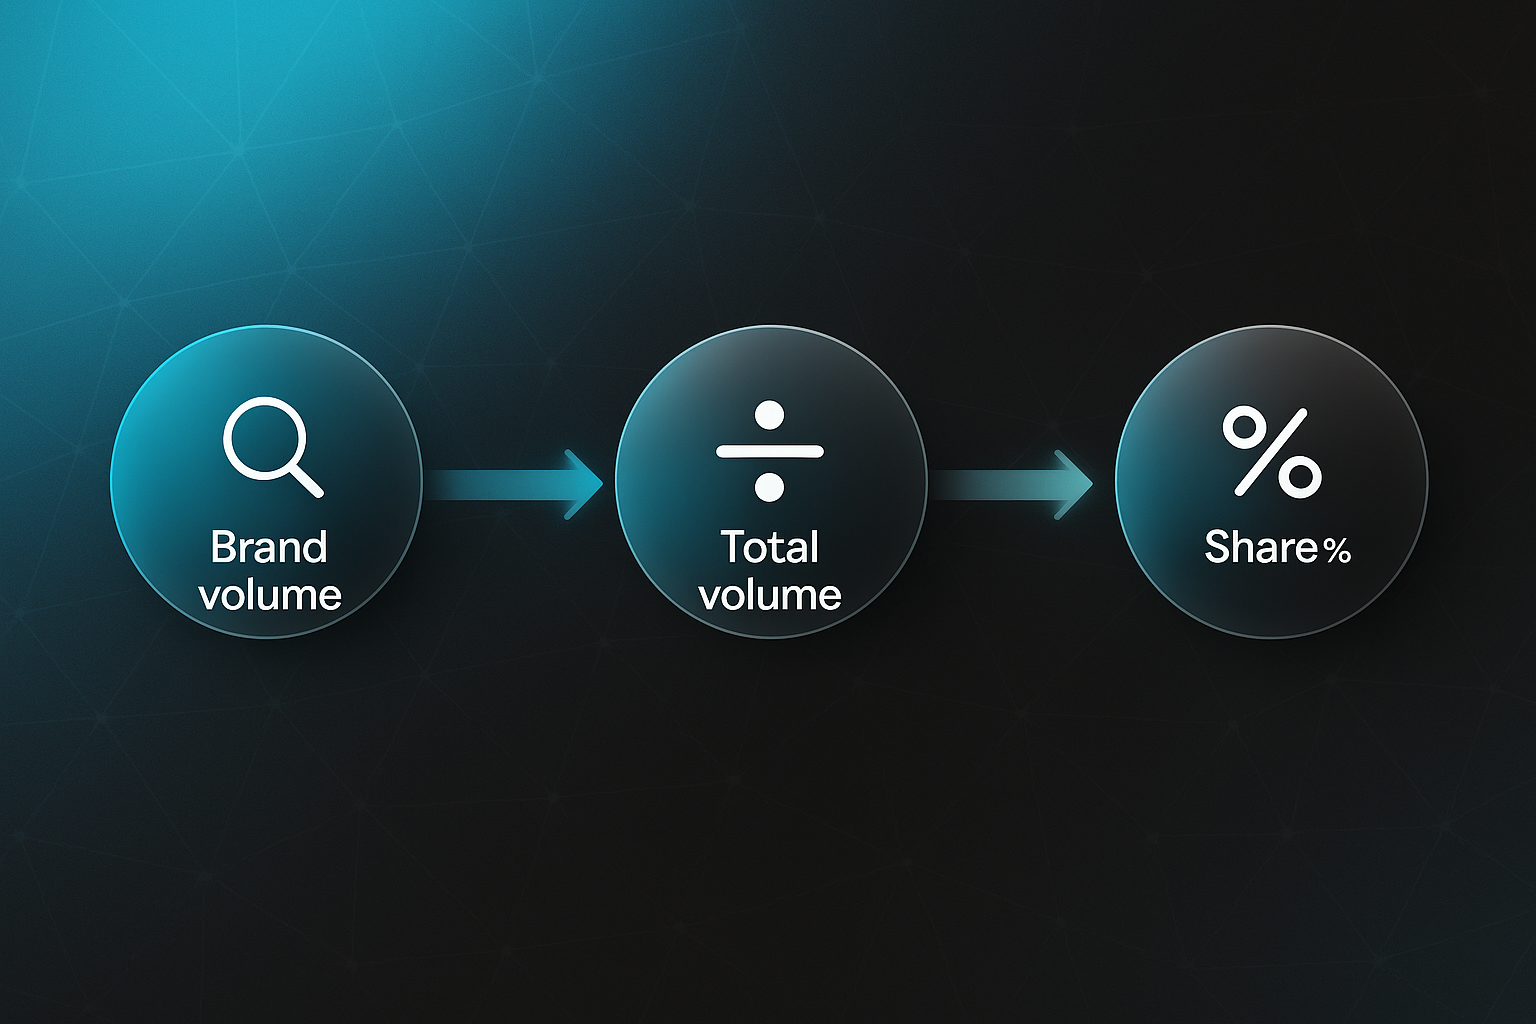
Now, the calculation is pleasantly straightforward — no algebra headaches required. You take the branded search volume for your brand, divide it by the total branded search volume for every player in your category, and multiply by 100.
Here’s the formula: (Branded search volume for a brand ÷ Total branded search volume for all category brands) × 100
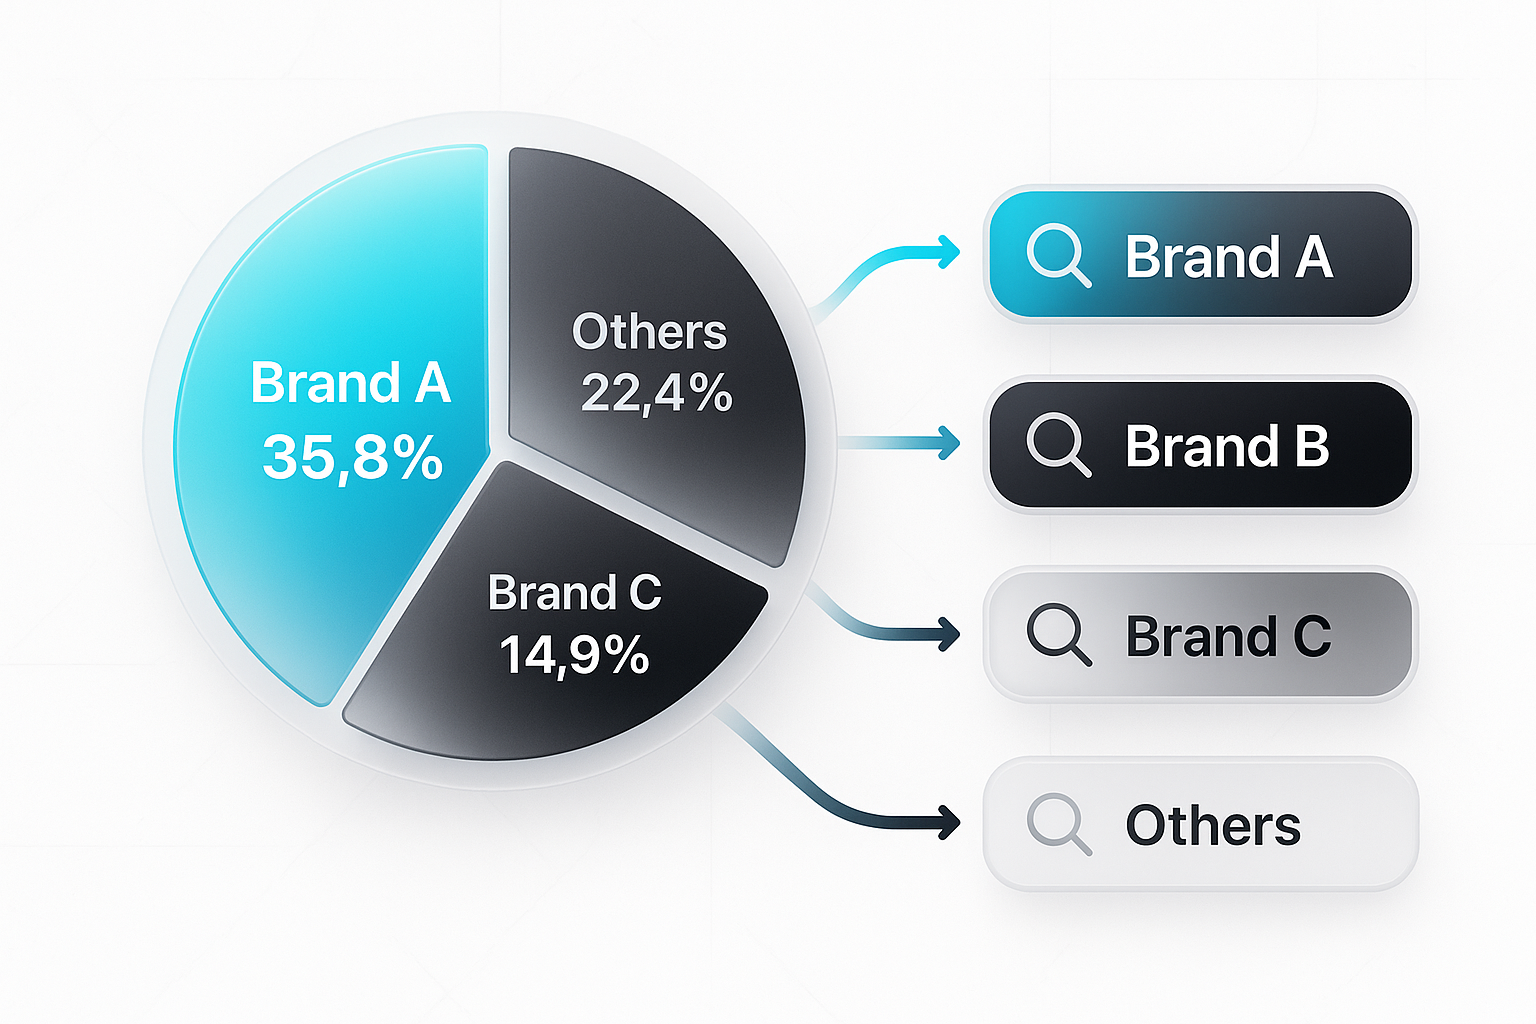
Let’s make this real. Suppose you’re comparing four brands in your sector:
- Brand A
120,000 searches/month - Brand B
90,000 searches/month - Brand C
50,000 searches/month - Brand D
75,000 searches/month
Add those up and you get a total branded search volume of 335,000 per month. So, Brand A’s share of search would be 120,000 divided by 335,000, times 100 — which equals 35.8%. That means Brand A is winning more than a third of the branded enquiries in its field. Quite a digital advantage.
A quick tip: for accuracy, include the brand name itself and any variations commonly used in searches. But steer clear of generic terms unless they’re uniquely and exclusively tied to your brand identity.
Tools commonly used to gather branded search data
- Google Trends
Tracks branded search interest over time and lets you compare brands instantly. - SEMrush
Supplies branded keyword volumes for both paid and organic searches, great for detailed analysis. - Ahrefs
Monitors branded keyword analytics and trends with robust volume tracking.
Here’s something to keep in mind — not every industry changes at the same pace. Tech and fashion brands might see share of search swing wildly with new launches and hot trends, while sectors like utilities stay fairly stable. Understanding these rhythms is instrumental in interpreting your data properly and spotting meaningful shifts.
Ultimately, this real-time, numerical metric lets you benchmark your digital presence, monitor competitors and react to your marketing impact much faster than old-school metrics ever could.
Why does share of search matter?
Share of search as an indicator of brand momentum
Ever wondered what’s going on in your customers’ minds before sales figures show it? That’s where share of search becomes invaluable. It acts as your brand’s early signal, surfacing shifts in consumer interest—often months before those changes are visible in sales or market share.
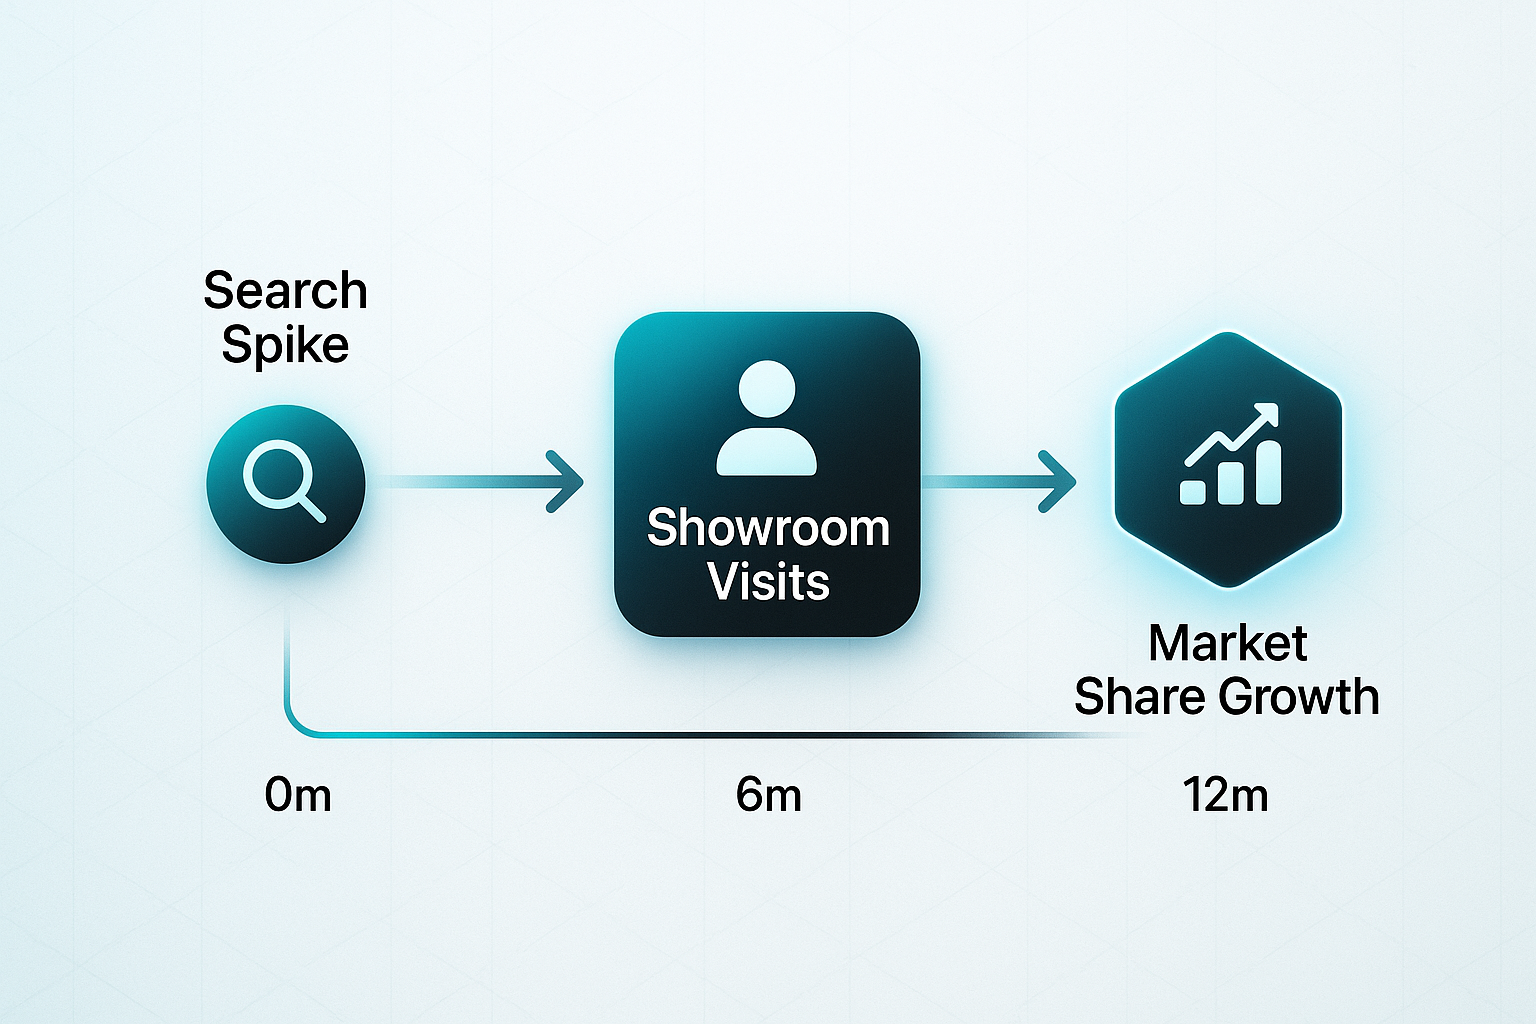
Imagine an automotive brand launching a new model. A swift rise in its share of search doesn’t just make for nice graphs—it genuinely foreshadows more showroom visitors and a real uptick in market share. Industry trends reveal these search shifts can come six to twelve months ahead of any market movement. By tracking your share compared to rivals, you can quickly spot who’s gaining ground and which campaign or headline lit the spark.
Advantages over traditional metrics
Here’s the real advantage—old-fashioned surveys and market reports are both costly and slow. Share of search flips that on its head by being timely and accessible. No waiting weeks for survey results; instead, tools like Google Trends put weekly or monthly insights at your fingertips.
A fascinating statistic? Research suggests share of search can predict up to 83% of future market share changes. This enables brands, no matter their size, to act on fresh, affordable insights—something that was once only a luxury for big players. It’s made brand monitoring truly democratic.
Share of search has been found to represent 83% of a brand’s market share, according to a study led by Vizer Consulting’s James Hankins for the IPA’s new share of search think tank.
Strategic implications for the marketing team
For marketers, this is where it gets genuinely exciting—share of search provides instant proof of campaign impact, letting you adjust your strategy fast. It strengthens your stakeholder reports by directly linking marketing activity to real consumer interest.
And when a competitor surges in search attention after a flashy campaign? You’re empowered to respond immediately. Ramp up your creativity, focus your spend, or recalibrate your messaging—because now you’re making evidence-led moves based on live consumer behaviour, well before sales reports tell the story.
To make evidence-led moves, marketing teams must analyze real-time consumer behavior to maximize digital conversion and revenue.
How to measure share of search
Step 1: Defining market category and competitors
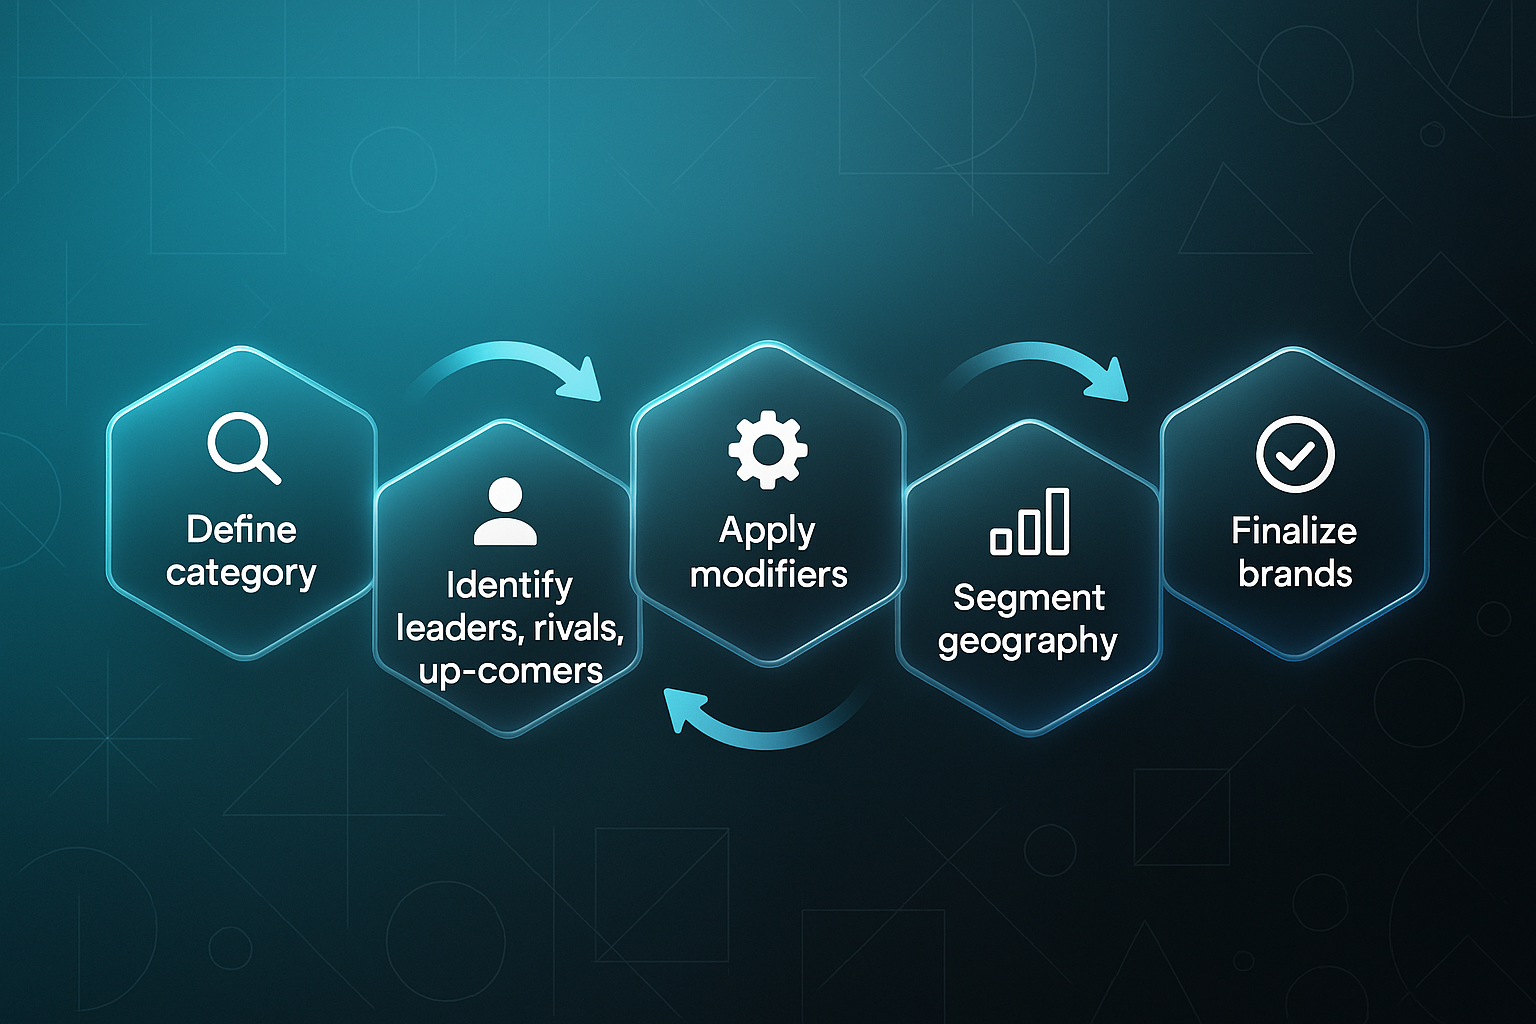
Let’s dig into where the process really begins—defining your market category. Choose carefully, because this step shapes every comparison that follows. If you’re in “premium skincare,” it’s not the same as “general skincare,” and your results will reflect these boundaries.
The point here is to get crystal clear on what sphere you operate in. Too broad a scope? You’ll end up pulling in rivals that don’t really matter to your actual audience. Too narrow, and you might miss important signals lurking just outside your current field.
Now onto competitor selection. What you want is a mix: the market leaders everyone knows, those direct competitors serving your core customers, plus any ambitious up-and-comers in your local area. Five to ten brands is usually spot on for balanced, meaningful analysis.
Industry lists and customer feedback can really help. They make sure your line-up is thorough—and not just built on assumption.
But here’s a little hitch—brand name ambiguity. Ever searched “Apple” and found fruit, computers, and music? Or “Jaguar” and run into cars, animals, or perhaps sports teams? It’s not just quirky; it can distort your data if you’re careless.
So, add modifiers—“Apple Music,” for example—to sharpen your brand signals and steer clear of irrelevant results.
Geography is another crucial factor. A UK-focused review will surface different competitors than a global one. Regional players, language differences, even seasonality—all affect how people search.
If your brand spans regions, run separate reports across each territory. This way, your insights aren’t just broad—they’re locally actionable for every market.
Getting any of this wrong, though, can have real consequences. Imagine a drinks brand looking only at “Coca-Cola” and “Pepsi,” missing new regional contenders, and misjudging its dominance. Or a fashion company ignoring local Asian rivals in global searches, overlooking big shifts just beneath the surface.
So, collect data over at least a year if you can. This captures seasonality and helps you see genuine patterns—rather than a blip caused by holidays or one-off events.
Scoping checklist
- Scoping checklist
Include direct and indirect competitors, capture regional differences, use precise keywords, and refresh your competitor list regularly.
Ambiguity watchlist
- Ambiguity watchlist
For brands such as “Orange” or “Shell”, use intent modifiers and always filter out unrelated search results.
Local vs. global analysis
- Local vs. global analysis
Segment data by market, adapting your approach as regions, product lines, and rivals inevitably evolve.
By setting up your analysis with careful category definitions, vigilant competitor selection, smart keyword choices, and market segmentation, you give yourself the best chance of scoring actionable, reliable share of search results.
It means you’ll track what matters—and sidestep those misleading blips and blind spots that trip up so many marketers.
Share of search vs. share of voice vs. market share
Definition of share of voice and market share
Let’s break down these three crucial metrics—each tells a distinct story about your brand’s performance.
Share of voice (SOV) shows how much attention your brand wins across media, advertising, or even social conversations. If your brand secures 20% of your industry’s ad spend, your SOV sits at 20%.
Market share is all about outcomes. It reveals what proportion of real sales—revenue or units—your brand claims in your industry. This is the key lagging indicator: hard, post-fact proof of business success.
And what about share of search? This one reveals how much branded curiosity you spark online compared to your competitors. While SOV and share of search predict attention and intent, market share closes the loop with concrete results.
Comparison table of key features and use cases
Here’s where it gets interesting—some metrics are like headlights, alerting you to coming shifts, while others are rear-view mirrors, confirming what’s already happened.
| Metric | Definition | Calculation | Indicator Type | Primary Use Case |
|---|---|---|---|---|
| Share of Voice | Brand presence in media or channel | Brand spend/mentions ÷ total market | Leading (sometimes lagging) | Media strategy, budgeting |
| Market Share | Sales outcome as proportion of market | Brand’s sales ÷ total market sales | Lagging | Performance reporting, planning |
| Share of Search | Brand interest in online searches | Brand search volume ÷ total category | Leading | Digital demand tracking, competitor benchmarking |
If your share of search spikes following a campaign, that’s often your first clue audiences are paying attention.
SOV helps you plan spend to stay visible in the present moment.
Market share delivers the final proof—showing whether your marketing is bringing home results.
The sweet spot? Track share of search and SOV for fast signals, then use market share to validate what’s working. That’s the power of marketing with both radar and clear outcomes—making sure you see both what’s coming and what truly counts.
Tools for measuring and improving share of search
SEOSwarm: AI-powered blog and SEO strategy platform
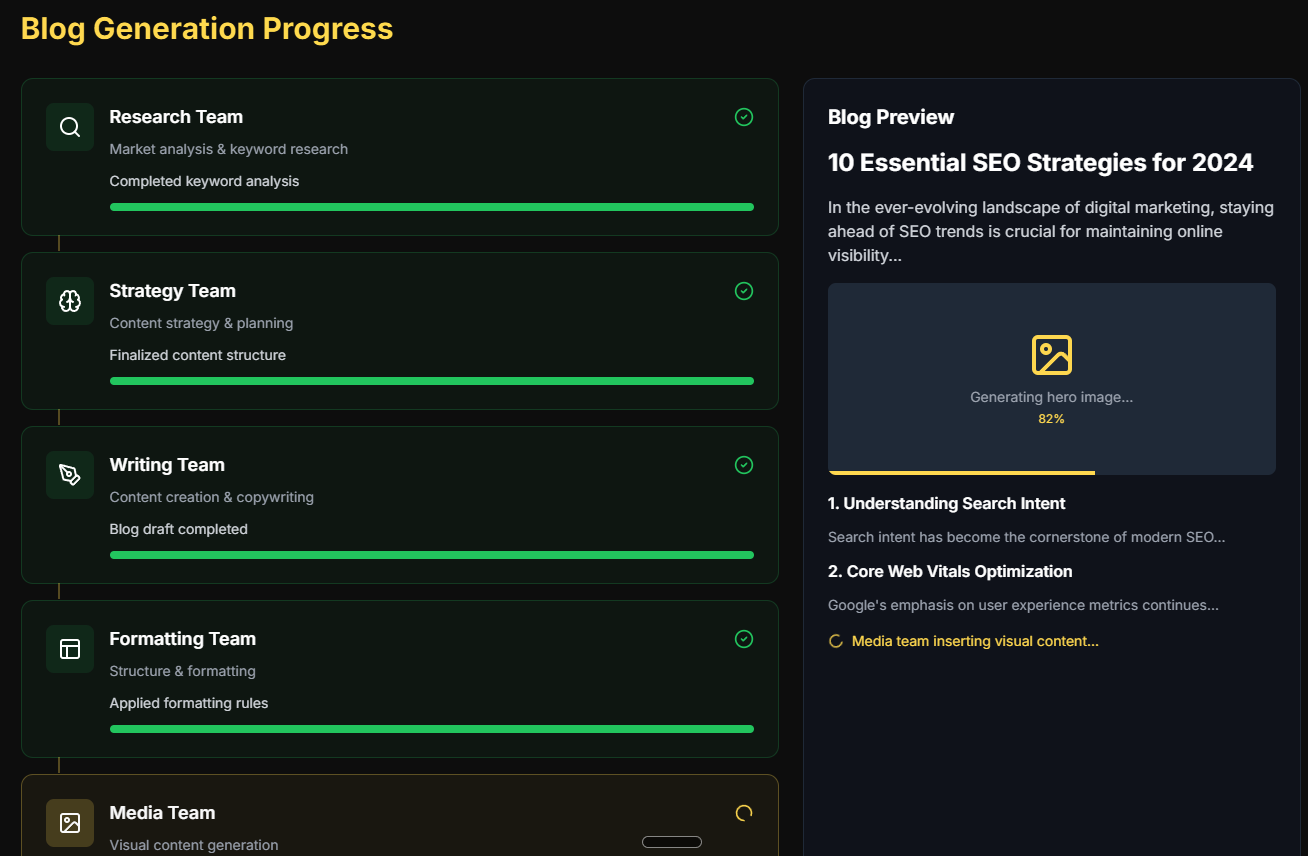
Let’s start with SEOSwarm—this platform goes beyond dashboards by automating branded search tracking, competitor benchmarking, and keyword analysis. The real value is how it turns all that data into actionable insights and AI-driven content, so marketing teams can scale output and track changes across multiple markets swiftly.
Picture a SaaS provider making a move into new countries. With SEOSwarm, they can automate local content, monitor competitor search trends, and pivot campaigns from one dashboard. That’s a significant data-driven strategy advantage.
Of course, there are caveats. There’s a learning curve at the beginning, and human creativity still matters—especially when it comes to standing out or handling nuanced, localised messaging.
Traditional SEO tools overview
Now, if you’d rather stick with classic platforms, you’ve got Google Keyword Planner, SEMrush, Ahrefs, and Moz Keyword Explorer. These are proven staples, offering detailed search analysis and competitor insights—though it’s up to you to bring the data together, update it regularly, and interpret results.
Retailers, for example, will be manually piecing together quarterly reviews, gaining granular analysis but sometimes responding slower than they’d like if a sudden shift occurs in the market.
How to choose the right tool for your team
- Scalability
Can you monitor multiple brands or markets easily? - Integration
Does it connect with your analytics or CRM? - Cost-effectiveness
Is it worth the cost in results? - Data depth
Are historic and competitor insights robust?
All-in-one solutions like SEOSwarm simplify reporting and content. Meanwhile, focused tools such as MyTelescope specialise in share of search metrics, while Brandwatch is all about social listening—useful, though less about direct search intent.
| Tool/Platform | Role | Strengths | Weaknesses | Example Use Case |
|---|---|---|---|---|
| SEOSwarm | Automated share of search | Scalable, integrated | Learning curve, creative limits | SaaS firm expanding regionally |
| SEMrush/Ahrefs | SEO, competitor tracking | Data depth | Manual work, slower response | Retailer tracking share shifts |
| MyTelescope | Share of search analytics | Dedicated insights | Narrow focus | Agency analysing campaign impact |
| Brandwatch | Social listening & sentiment | Channel coverage | Not direct for search demand | Manager monitoring launch buzz |
Balance automation, specialist insights, and your team’s capacity. That’s how you find a tool that genuinely supports your share of search ambitions.

AI-Powered Content Strategy
See the AI platform that's replacing entire content teams (with better results).
The predictive power of share of search
Share of search as a leading indicator for market share shifts
Here’s where things get genuinely fascinating—share of search isn’t just another digital metric; it’s like an early warning system for market share changes. Industry research reveals an average correlation of 83% between branded search patterns and what happens later in actual sales.
Some sectors dial that link up even higher. For mainstream car brands, the correlation hits an eye-popping 0.92. In restaurants, it can soar all the way to 0.96. It’s remarkable how reliably shifts in search behaviour predict what’s about to unfold across the market.
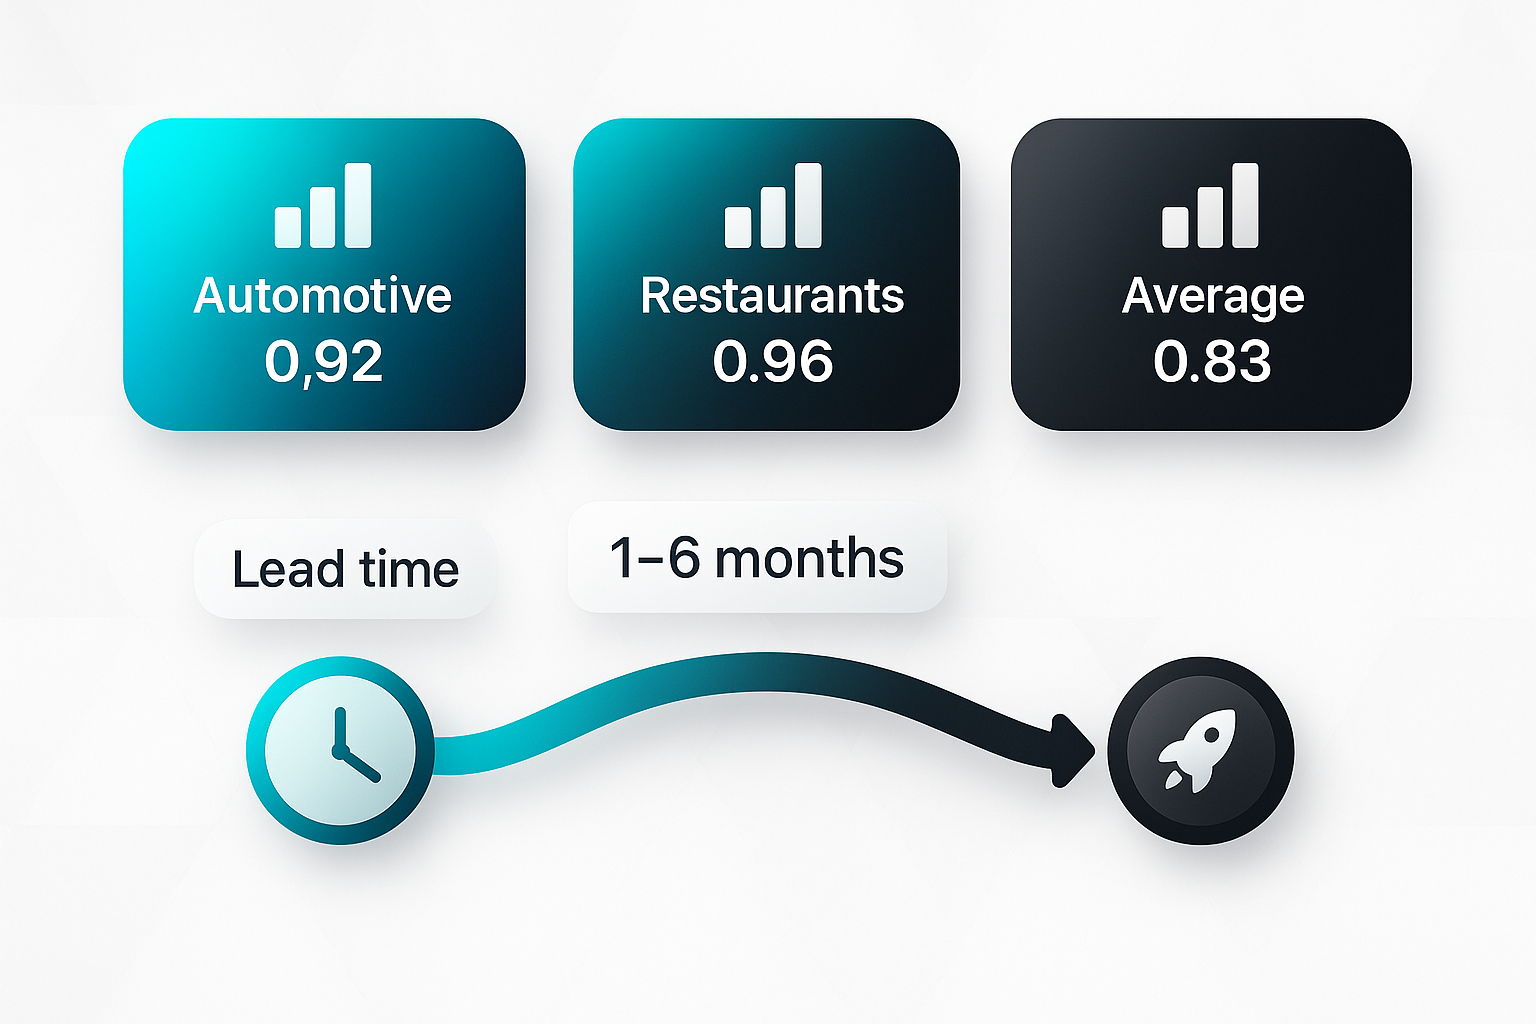
But what really sets this apart is the timing. You often get a valuable lead time—anywhere from one to six months. When share of search jumps (or slumps), you receive advance notice to pivot your strategy, shift budgets, or launch fresh creative before the story plays out on your sales dashboard.
The evolution of data-driven marketing enables a critical shift from reactive analysis to predictive intelligence. By leveraging emerging technologies, firms can implement early warning systems to forecast market shifts, providing a significant lead time advantage for proactive strategy adjustments and resource optimization.
So how do ambitious brands exploit this insight? They monitor branded search volumes closely through major campaigns and beyond. If a competitor’s branded search suddenly surges, that’s not just noise—it’s often an early bell that they could be about to claim more market share.
Still, context matters. With mass-market products, these predictions tend to hold strong. For aspirational or luxury brands, browsing may simply mean dreaming, so blend share of search with other vital metrics to get the clearest picture.
That predictive edge isn’t to be underestimated—it can give proactive marketers a crucial advantage over rivals still waiting for sales data.
Best practices for leveraging share of search
Maintaining accurate branded keyword lists and competitor scopes
Staying sharp with your branded keyword list is a non-negotiable. It’s all about keeping pace as consumer language shifts—maybe because of a product launch, maybe thanks to a cultural moment that catches fire. You’ll want to regularly audit and refresh your list, dropping outdated terms and bringing in the latest ways people mention your brand.
Leaning on platforms like Google Trends or SEMrush can spotlight new, brand-relevant queries fast. And don’t forget, tracking exact brand names plus common misspellings or intent-rich terms really makes the data sing. The trick is capturing how real people actually search.
But it doesn’t end there. You also need to keep an eye on which competitors belong on your radar. This means not just the usual suspects, but those ambitious challengers popping up on the scene. Using Ahrefs or sector analytics, you can check who’s genuinely pulling attention in search—not just coasting on reputation.
Integrating share of search into reporting and strategy
How do you keep this momentum actionable? Slot share of search reviews into your monthly or quarterly cycle. That rhythm gives you the clearest reads on seasonality, benchmarks, and sudden campaign surges. Always pin down your baseline before rolling out big campaigns—then compare before-and-after results to measure uplift.
What that shows you is invaluable: what’s working, where to double down, and which messages land best. It’s like having built-in campaign feedback for marketing and even broader team planning.
Cross-team education and adoption
Here’s the thing—share of search isn’t just for the SEO or analytics crew. When everyone, from marketing to content and beyond, gets to grips with it, you unlock real power. Practical training sessions and live case studies help the whole team get it—showing how these insights translate into success. Fold this thinking into regular reviews and all-hands meetings, and you’ll notice cross-team enthusiasm building.
And when a department uses share of search to ace a campaign? Celebrate it. Those stories inspire broader buy-in and make this metric woven into your company’s wider strategy.
Common challenges and how to overcome them
Incomplete competitor or keyword sets
If your competitor list or keyword bank is too narrow, your share of search insights won’t show the true picture. It’s surprisingly easy to overlook new market entrants or shifting customer language, and that can quietly mask key threats or promising opportunities.
What’s the way forward? Schedule regular reviews to broaden your competitor list. Include those new faces and indirect brands that might not be obvious. Also, keep your branded and generic keywords fresh by tapping into recent search data and live consumer feedback.
Tool and data limitations
Relying on a single tool—Google Trends, SEMrush, or anything else—is like looking through a single window. Platforms alter, habits shift, and fresh data sources pop up constantly.
Instead, combine insights from several tools to create a more rounded analysis. Document your assumptions and ensure your approach adapts as voice search, AI, or emerging channels reshape the landscape.
Short-term focus and lack of trend monitoring
It’s tempting to read every sudden spike or dip as significant. But short-term shifts are often just reactions, seasonal quirks, or noise, not long-term trends.
Adopt rolling averages, track against campaign timelines, and always check share of search changes versus broader business KPIs. You’ll sidestep hasty decisions, anchoring your actions in real patterns rather than passing fads.
Real-world examples and case studies
Brand tracking post-campaign
Insurance and automotive brands rely on share of search immediately after major campaigns to gauge sales momentum. A modest 5% boost in branded searches following TV or digital advertising often signals genuine market share growth ahead.
In the insurance sector, uplifts in searches for “car insurance” regularly foreshadow rising premiums. Marketers benchmark success and adjust future strategy based on these early signals—months before sales figures land.
Monthly or quarterly reviews help teams track trends well before revenue data, ensuring early detection rather than reactive analysis.
Competitive benchmarking campaigns
Challenger SaaS brands use SEO-driven content hubs to climb share of search and disrupt industry giants. They publish targeted articles on key branded and category keywords, which quickly boosts direct brand queries and organic traffic.
The formula is speed paired with pinpoint keyword selection. Benchmarking shows a 10–30% uplift in sales often follows these jumps in share of search.
SEOSwarm in practice
Retail ecommerce companies show how automation propels share of search. AI platforms like SEOSwarm let brands launch hundreds of SEO-optimised pages, driving double-digit growth in organic visits and sales.
Leading firms track both automated and traditional content impact, using share of search as a core KPI. This allows rapid market trend detection and fully data-led brand visibility.
Blog-in-one-minute
Add a fully SEO-optimised blog to your website with just 2 lines of code.
The future of share of search in digital marketing
Emerging trends and adoption in marketing teams
Share of search is rapidly emerging as a crucial KPI for brand health and competitive tracking. More marketing teams are weaving it into ongoing planning and reporting for real-time insight—sidestepping survey delays and catching shifts as they happen.
Unified analytics platforms now mix share of search with social engagement and sentiment data. This combination offers a multidimensional view, letting you spot new opportunities—and threats—faster than ever.
But here's where it gets intriguing: the rise of digital and AI-powered assistants like ChatGPT and Google Bard is altering how brands track visibility. With zero-click searches and generative AI answers becoming the norm, teams are updating measurement dashboards to track brand exposure in these fresh spaces. Staying visible takes a blend of creativity and agility.
AI and automation’s role in improving share of search measurement
AI-driven solutions such as SEOSwarm now automate branded keyword monitoring and competitor benchmarking with real-time alerts. Machine learning highlights genuine shifts in interest, while predictive analytics helps gauge demand and guide campaigns.
Crucially, these tools are evolving to track brand presence in zero-click results and generative AI summaries—ensuring marketers stay proactive as digital discovery shifts and new channels emerge.
My Advice on Using Share of Search
The real edge in digital marketing isn’t just knowing where your brand stands—it’s spotting the shift before your competitors do. Share of search gives you that early signal, letting you see rising interest, campaign impact, and looming threats months before sales numbers catch up.
Here’s my advice: set a regular cadence for reviewing your share of search. Use a mix of tools—Google Trends, SEMrush, or SEOSwarm—to track branded keywords, update your competitor list, and segment by market. Don’t just watch the numbers; act on them. When you see a spike or a slump, dig into the why and adjust your strategy fast.
Share of search isn’t a static metric—it’s your brand’s pulse in a changing market. The brands that win are those that treat it as a living signal, not a quarterly checkbox. If you want to lead, start measuring what matters before your rivals even know the game has changed.
— Wil